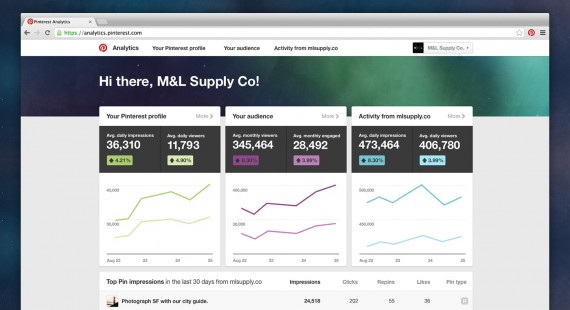
Pinterest recently launched a new version of its analytics tool. It can help ecommerce merchants connect with their customers and prospects, on and off Pinterest.

Pinterest just launched a new version of its analytics tool.
You must have a business account to use Analytics. In the event you set up a personal profile for your company instead of a business account, Pinterest has a form you can use to change the status. If you do not have a Pinterest account of any type, go to business.pinterest.com and create one. It takes just a few minutes.
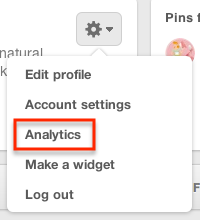
Once the account is set up, go to your profile and click the gear menu, and then “Analytics” to view data. It will take some time before data starts collecting.

Click the gear button and “Analytics” to view your data.
The new Pinterest Analytics tracks data about your business profile, audience, and website.
It enables you to:
- See what content people like most both from your Pinterest profile and website, along with how much traffic your site gets when you add the Pin It button.
- Explore metrics about your audience (the people who engage with your business). You can see your audience’s most common interests and what other businesses they follow, then tailor your pins accordingly.
- Get advice on how to increase impressions, clicks, and repins to refine your Pinterest strategy and reach more people.
Pinterest Profile
Click “Your Pinterest profile” at the top of Pinterest Analytics to see activity related to your profile.

“Your Pinterest profile” shows data related to your business profile.
Profile data is organized into four sections: Impressions, Repins, Clicks, and All-Time.
- Impressions. The number of times a Pin from your profile has appeared on Pinterest home feeds, category feeds, and search.
- Repins, The number of times someone saved your Pin to one of his or her boards.
- Clicks. The number of clicks on Pins from your profile.
- All-Time. This page includes a variety of metrics including:
- Most repined: Your most shared pins;
- Best in search: Pins that rank higher in search;
- Power Pins: Pins with a high mix of repins, clicks and more.
Pinterest Analytics presents metrics as a daily average. In addition, you can use the date picker to view data from select time periods, click the “All apps” menu to filter profile data by device, and export the data to a CSV file by clicking “Export data.”
Audience
This section displays information about the people who interact with your pins — both from your profile and website — based on demographics and interests.

“Your audience” presents data about what is of interest to your followers.
- Demographics. You can view demographic data including:
- Average monthly viewers: the average number of unique impressions;
- Average monthly engaged: the average number of people who took action on your pins such as repins and clicks.
You can also see the country and city that visitors come from, as well as language and gender.
Two drop-down menus — “All apps” and ‘All audiences” — allow you to filter information based on the device used and your followers.
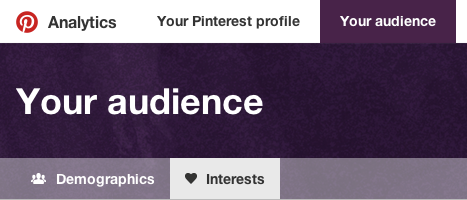
- Interests. This section provides a peek into what is of interest to your followers — metrics that can help guide your pinning strategy going forward. It shows a collection of interests, boards from your audience that contain your pins, and other businesses your audience follows.

See what interests your followers.
Website
In this section you can see how pins linked to your website are doing.
You will need to verify your website for Pinterest to gather data for it. (Verifying your website tells Pinterest users that you own it.)
You will be able to see metrics on the following.
- Total impressions. How many times your pins have appeared in someone’s feed;
- Total repins. The number of times someone added an existing pin linked to your website to one of their own boards;
- Clicks. The number of clicks back to your website from pins that link to it.
Similar to the Profile and Audience sections, you can use the drop-down menu to filter website data by device, and view “All-Time” data such as the most repinned items, most searched for pins, and pins with the highest engagement by Pinterest users.
Pinterest Analytics Best Practices
Pinterest suggests the following best practices for using Analytics to increase reach and engagement.
- Review the sections that show your top pins and boards. Pins with the most impressions usually represent content for which users are actively looking.
- Pay attention to the repins and boards sections. These embody content that users find interesting enough to save and share.
- Analyze the most clicked pins and boards sections. Pins with the most clicks typically represent content that users want to learn more about, take action on, or purchase.
- Add the Pin It button to your website. Prominently display “Pin It” on product pages and even across the entire breadth of your site. Doing so will increase the number of impressions and encourage more pinning.
- Check your mobile site. Many pinners use mobile devices to access Pinterest, so check your website to ensure pins work there.
- Watch trends over time. Analytics allows you to set date ranges so you can see what people are pinning and how it trends over time.


