The coronavirus-induced shift in shopping behavior has been a boon for some online retailers and a bust for others. The impact depends on the products, geography, and marketing channels.
Google Analytics can identify pandemic-related problems and opportunities for your business. I’ll explain in this post.
Current Status
Most merchants are aware of daily revenue. Sales of groceries and other essential items have grown 50 percent or more compared to past years. Sales of high-ticket items, however, have likely contracted.
To measure your business’s activity, in Google Analytics go to Acquisition > All Traffic > Channels. Then choose a recent date range, such as the last 30 days, and select “Compare to” (top right, near the date range) and select “Previous year.”

Choose a date range and select “Compare to” (top right, near the date range) and select “Previous year.” Click image to enlarge.
Look at changes (overall and for each channel, with Enhanced Ecommerce) in Users, Sessions, Transactions, Conversion Rate, and Revenue.
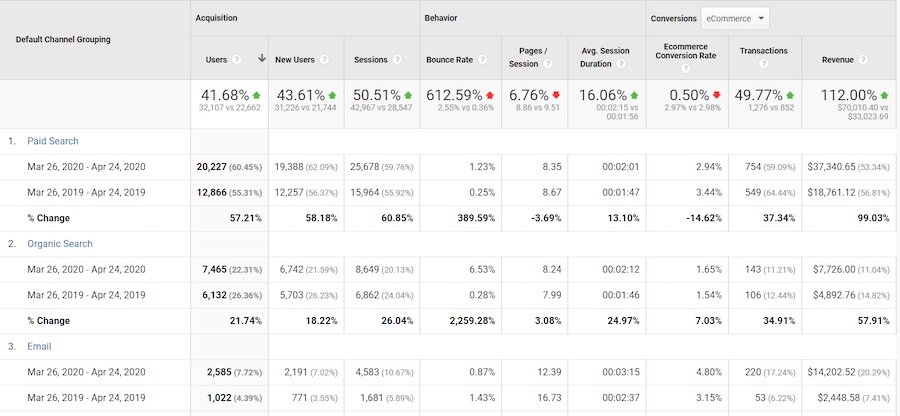
Look at changes for each channel in Users, Sessions, Transactions, Conversion Rate, and Revenue. Click image to enlarge.
Look closely at the data.
- Was revenue higher, lower, or unchanged?
- Did specific channels, such as Paid Search or Organic Search, change more than others?
- Did conversion rates change significantly?
Geography
Covid-19 has impacted worldwide regions by varying degrees. Analyze how geography affects your business at Audience > Geo > Location. Select the countries with the most sales.
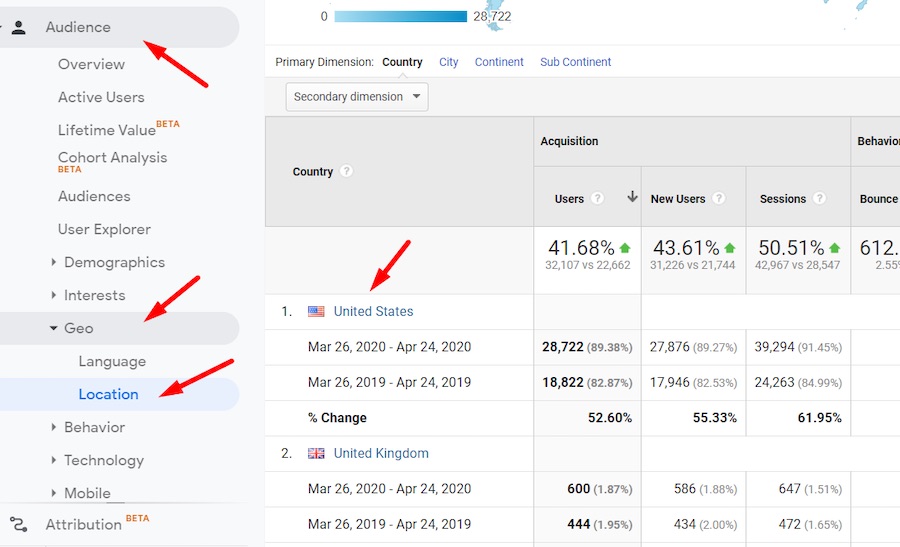
Analyze how geography affects your business during the Covid-19 pandemic at Audience > Geo > Location. Click image to enlarge.
Then compare current performance for regions (i.e., states, provinces) with the previous year. In the example below, New York and New Jersey experienced much higher revenue growth than other U.S. states.
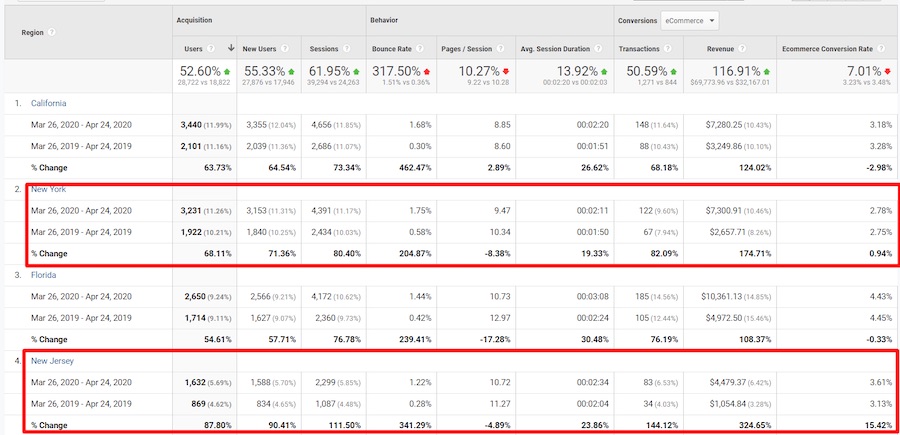
Compare current performance for regions (i.e., states, provinces) with the previous year. Click image to enlarge.
Products
Check the products that had the biggest shift in sales year-over-year at Conversions > Ecommerce > Product Performance. Compare by Product and, also, by Product Category.
In the example below, reporting by Product Category identified a substantial sales increase in a grocery item (olive oil) but a decrease for soaps. The drop in soap sales may appear counterintuitive during an epidemic. But the soap, in this case, is not antibacterial. Shoppers likely preferred germ killers.
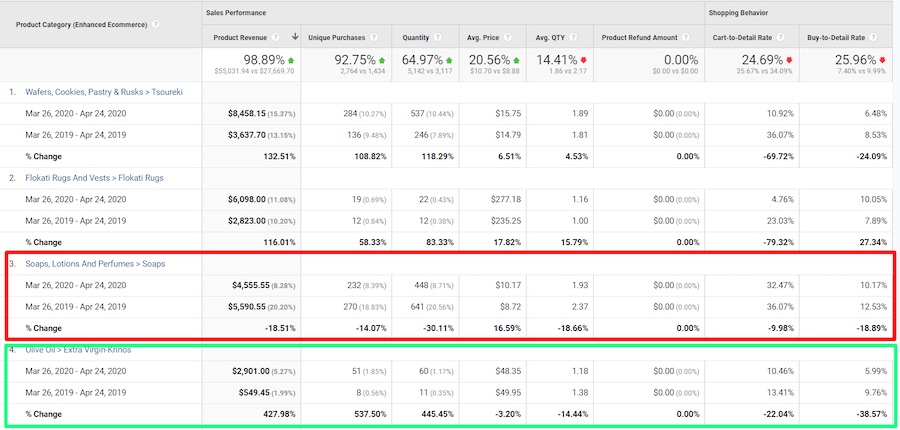
Reporting by Product Category identified a substantial sales increase in a grocery item (olive oil) but a decrease for soaps. Click image to enlarge.
Advertising
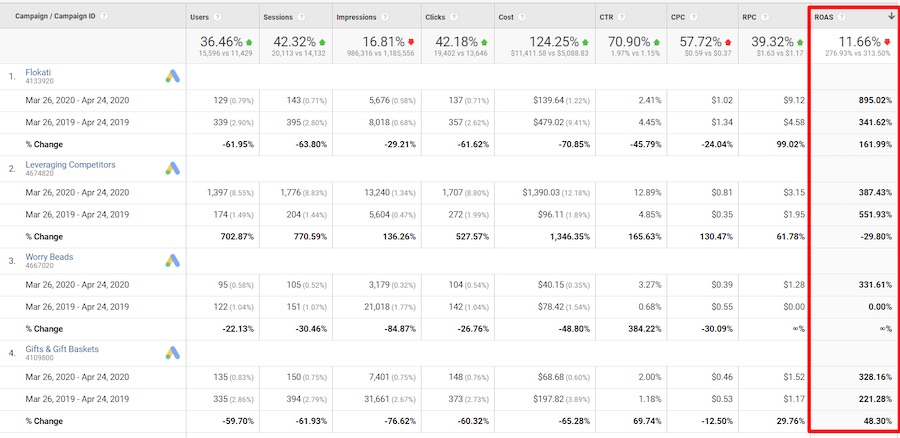
Investigate shifts in performance for paid search. For Google Ads, go to Acquisition > Google Ads > Campaigns > Clicks to compare 2020 to 2019.

To analyze performance changes for Google Ads, go to Acquisition > Google Ads > Campaigns > Clicks. Click image to enlarge.
Then, identify shifts in return on ad spend (ROAS) by the Google Ads’ campaign.
Look closely at Ad Groups, Keywords, and, especially, Search Queries, which can indicate opportunities for new or existing products. If you have imported cost data for Microsoft Ads and other paid search channels, analyze those as well.
Pivot
Adjust your business based on the analyses above. Consider:
- Updating your home page to showcase high-demand products.
- Shifting inventory purchases to top sellers.
- Using Search Query data to identify new product opportunities.
- Fine-tuning paid search, affiliate ads, Facebook ads, and other marketing knobs based on the reports.
For paid search, do not focus solely on overall costs-per-click. Tweak geo-based bidding and product and category bidding if the data suggests it.
Given the massive impact of Covid-19, it’s essential to monitor your KPIs frequently. Build a Data Studio report for instant visibility. Quickly seize opportunities and fix problems to prosper in these unprecedented times.

