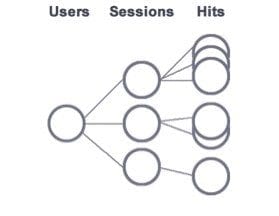
Benchmarking is an insightful tool in Google Analytics. It compares your site’s performance to previous results and to your industry’s average.
It provides valuable context to your business, gives insights into industry trends, and helps to compare your indicators to competitors. Contextualizing your site’s performance is a good way to measure the work you have done, plan ahead, and set meaningful targets.
1. Enabling Benchmarking in Google Analytics
Log in your Google Analytics account and navigate to Admin > Account Settings.
Scroll down and ensure that the “Benchmarking” box is ticked. Click “Save.”
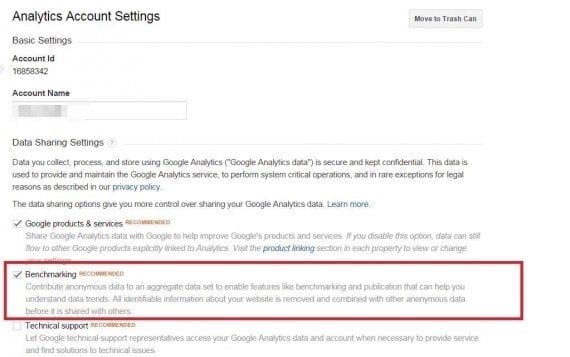
First step is to enable Benchmarketing.
2. Ecommerce Historical Benchmarking
Historical benchmarking means that you set expectations based on your own historical performance. For example, you can set benchmarks comparing data from previous years or previous quarters.
Look at month-over-month trends across years and month-over-month trends for each year. This set of numbers can serve as benchmarks. To make a forecast, take into account a number of factors, such as major changes in your marketing and customer acquisition strategy over the last time period, shifts in investment, and insider knowledge.
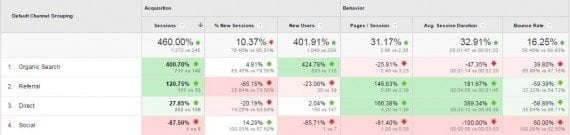
For example, you can compare how your acquisition channels performed this year versus last year. For this you should select the Acquisition section in the Reporting tab then choose All Traffic > Channels and go to the calendar selector. Select the date range of this year and put a tick in the checkbox “Compare to” and select “Previous year.” Click “Apply.”
From the image below, you can see that Organic Search shows much less growth of new users as compared to Direct traffic — 8.66 percent vs 62.22 percent. By analyzing previous years, we can set benchmarks for the growth of new users for each channel in comparison to the previous year and determine whether organic search has underperformed or grown in the year in view.
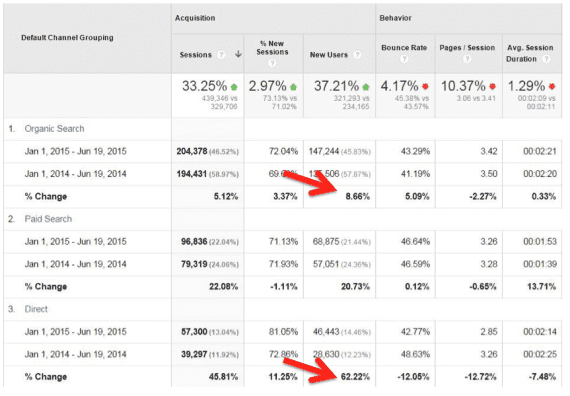
In this example, Organic Search shows much less growth of new users as compared to Direct traffic — 8.66 percent vs 62.22 percent.
3. Ecommerce Industry Benchmarking
Ecommerce benchmarking is valuable because it provides the necessary context of increases or decreases of metrics that you track that may not have arisen as a result of your actions, but from wider industry trends.
For example, if you noticed significant traffic from the U.K., ask if your competitors also seeing this too or is it a result of your latest campaign. Or if you see an increase in traffic from mobile users, try to determine if this as a result of a global trend or your latest mobile-friendly design. Google Analytics Benchmarking will help you answer these questions.
This wealth of information gathered by individual sites, anonymously combined and shared, requires a large volume of reliable user data — which Google Analytics has — to make it valuable and meaningful for specific businesses.
Google Analytics benchmarking covers three main dimensions: (a) traffic sources, (b) location and device, and (c) six additional metrics: sessions, percentage of new sessions, new sessions, pages per session, average session duration, and bounce rate.
Google identifies your sites across three benchmark indicators:
- Industry vertical (over 16,000 different options);
- Geographic region;
- Seven traffic size classifications.
Benchmark reports enable you to alter these indicators within the report. You can change your site’s vertical and compare its performance to alternative business types, locations, and sizes.
4. Benchmark Reports
Enabling data sharing activates reports in your account, which allows data to be shared anonymously. The reports appear under a new Benchmarking option within the Audience section.
The Benchmarking tool is composed of three reports: Channels, Location, and Devices. Here is the navigation panel in these reports. The numbers in the red boxes correspond to filtering options, which I’ve explained, below.
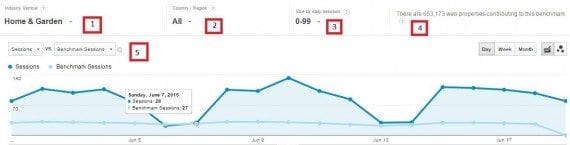
Filter benchmarking reports by many criteria.
- Industry Vertical. This allows you to choose the vertical and sub-vertical to compare your website to. Note that the deeper you go in the vertical hierarchy, the smaller the sample size you are comparing your website against.
- Country / Region. This allows you choose the country and region you want to benchmark against. As above, if you benchmark against the U.S., the sample will be much larger than benchmarking against, say, California. Thus, there’s a tradeoff between accuracy and precision.
- Size by daily sessions. The size of the business in terms of average number of daily sessions.
- Benchmark group size. The number of properties that contribute data to establish this benchmark.
- Benchmark metrics to chart. You can choose a number of metrics to be shown in the chart. Here are the options: % Benchmark New Sessions, % New Sessions, % New Sessions Benchmark Delta, Benchmark New Users, Benchmark Sessions, New Users, New Users Benchmark Delta, Sessions Benchmark Delta, Avg. Benchmark Session Duration, Avg. Session Duration, Avg. Session Duration Benchmark Delta, Benchmark Bounce Rate, Benchmark Pages / Session, Bounce Rate, Bounce Rate Benchmark Delta, Pages / Session, Pages / Session Benchmark Delta.
Apart from those navigation options, you will also see, just above the chart, two new icons that can be used to show or hide the colors on the table — green and red — and the comparison numbers.
The use of colors helps you to identify overperforming or underperforming metrics versus the benchmark. Green — generally positive values — means you’re doing better and red indicates potential areas of improvement — generally negative numbers. The stronger the color, the wider the difference compared to the benchmark.

The use of colors — green and red — helps to identify overperforming or underperforming metrics versus the benchmark.
Now, let’s look at each report.
Channel Benchmarks
This report helps you better understand your performance against similar businesses from an acquisition channel standpoint. It helps answer questions such as:
- Are my social campaigns performing well?
- Should I invest more in display advertising?
- Is my website search-engine optimized as compared to my competitors?
5
Location Benchmarks
The Location report compares your country/territory data to the benchmark of each country/territory you receive traffic from. This report provides metrics by country, which are handy for ecommerce sites that sell internationally, to understand where across the globe you are performing well, or not.
If you operate in just a single country, it will be simpler to understand. But if you have a global audience it might be interesting to use this together with the other reports. For example, if you see that you are underperforming in Canada, go to the Channels report and see the underperforming channels in Canada.

The Location report compares your country/territory data to the benchmark of each country/territory you receive traffic from.
Device Benchmarks
The Devices benchmark report compares your device traffic reports to desktop, mobile, and tablet traffic benchmarks in your industry. It is an insightful report that shows how well your traffic by device type compares to competitors in your industry.
Not all sites have fully embraced mobile browsing. The results vary massively by industry. In retail, some businesses already receive more traffic from tablets and mobile than from desktops.
However, for Finance, for instance, some sites are only seeing about 35 percent of traffic from mobile and tablet devices.
As with the Location report, the data is only available at this one level of depth. You cannot compare results by specific device or operating system, for example. But it still serves as a good marker as to where you stand.
5. Interpreting Benchmark Reports for an Ecommerce Site
How can benchmarking report data be interpreted? Here are a few ways to interpret each report.
Channel. Using the Channel report, merchants can compare, say, traffic and acquisition from organic search versus paid search, or direct versus referral traffic.
Location. If you sell products internationally, carefully study your behavior metrics. Numbers that are lower than the benchmark for certain territories may indicate a problem with irrelevant content to the specific country, or could hint a problem with your pricing or delivery proposition. Alternatively, if you’re receiving engaged traffic from an area you do not currently service, this could highlight an opportunity for potential growth.
Devices. From the report below, this ecommerce site appears to be significantly outperforming desktop and mobile traffic benchmarks, by 229.02 percent and 58.93 percent, respectively. It is, however, receiving 30.56 percent fewer sessions from tablet devices. This likely indicates a shift as in how the site’s customers shop in comparison to overall industry.
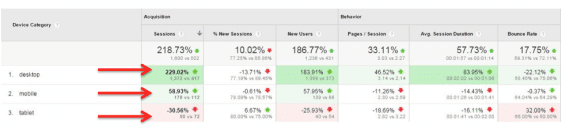
However by looking at the site’s behavior metrics, you could notice underperformance on mobile devices in comparison to its benchmark engagement rate. This might indicate that this site is not as mobile-friendly as other players in its industry and could use further mobile optimization.
This Device report, then, could provide a hint as to whether you are offering an optimal experience to mobile users and may also provide insights as to whether your competitors are far ahead of you, or struggling with the same issues you are.
It could help you know whether the splits of traffic you’re seeing by device are on a par with your industry.
Wrapping Up
Benchmarking provides very helpful context of your site’s performance in relation to other sites in your industry. You can compare your site’s performance in areas such as geo-location, device, and acquisition channels. These insights should improve your marketing decisions and, thus, your site’s performance.