Google Analytics offers several powerful reports that can help businesses monitor how quickly web pages are loading and identify what factors may be causing poor performance.
How quickly a website loads can have a direct impact on user experience and, in the case of ecommerce sites, user experience can have a direct impact on conversions, sales, and profit.
What Google Analytics Site Speed Reports Measure
Google Analytics captures load times and other page performance data from about one percent of a site’s total traffic. The performance data is captured using the relatively new HTML5 Navigation Timing application programming interface, so there are minimum browser requirements, meaning that Internet Explorer versions before 9, versions of Firefox before 7, and versions of the Android browser before 4, as examples, cannot report data.
The data collected includes information about the user, like where the user is located; what browser the user has; and which operating system the user is running.
Google Analytics also collects the average load time for each page sampled. This metric is made up of two factors, including the time it takes the server to respond to the page request and the time it takes the browser to parse, download, and display the page.
Google Analytics also breaks down the individual steps in the page loading process, capturing, among other things, the following items.
- Average Redirection Time. Measures how long it takes the site to redirect from one URL to another before the page is fetched.
- Average Domain Lookup Time. Measures the time spent associating a domain name with its assigned server. In some cases, changing the company that provides a site’s DNS registration can improve this aspect of page performance.
- Average Server Connection Time. Measures the time needed to connect to the web server.
- Average Server Response Time. Measures the time necessary for the server to respond, including the time the response takes to get to the user’s browser.
- Average Page Download Time. Measures how long it takes the browser to download the page content.
- Average Document Interactive Time. Measures the average number of seconds the browser requires to parse the page’s document object model (DOM) to a point at which the user can begin interacting the page, even if the page DOM has not completely loaded.
- Average Document Content Loaded Time. Measures the average number of seconds needed for the browser to parse the DOM completely, but not to a point at which not all of the style sheets or pictures have completely loaded. Effectively, this metric tracks the seconds until a JavaScript framework, like jQuery, will typically assume the DOM is ready and begin execution.
About Google Analytics Site Speed Reports
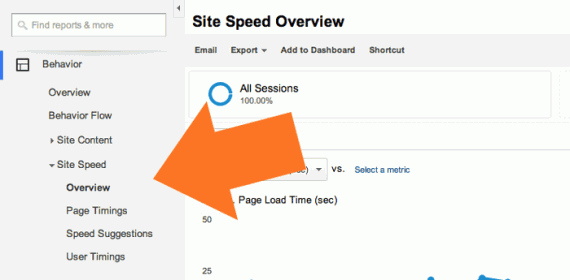
The Google Analytics Site Speed reports are located in the Behavior (formerly Content) section of the tool’s left side navigation. The Site Speed section is made up of sub-sections, including Overview, Page Timings, Speed Suggestions, and User Timings.

The Site Speed reports are located in Google Analytics Behavior category.
As one might expect, the Overview section gives users a broad look at the site’s average page load times and performance by location and browser. The key takeaway from this section may be the overall average page load time for the site. There is data, including reports from Google and Microsoft, suggesting that businesses should aim for page load times of two seconds or less, but many online businesses have websites that take significantly longer to load.
The Page Timings section and Speed Suggestions section are among the most helpful for many online businesses, since they provide the bulk of the page performance data and some real-world suggestions about how to improve page performance, respectively. More about using these sections follows.
The User Timings section requires some special configuration that is beyond what will be covered here. Just know that this section can be used to monitor in great detail how individual resources — like a particular image or even an add-to-cart button — are loading.
The Page Timings Section
There is a significant amount of data available in the Page Timings; users should take time to explore the reports, changing views and the data reviewed.
There is a bit of navigation within the section. To start, open the Explorer tab, load the Technical sub-tab. For the primary chart on the page, compare pageviews versus the average page load time in seconds. This data should identify any spikes in average page load times relative to the number of pageviews.

Comparing average page load times for a site with pageviews can identify unusual changes in performance.
In the example chart shown above, average page load times nearly doubled on June 13, 2014 (see the orange arrow), but pageviews were somewhat in keeping with a typical Friday for the site. Armed with this data, the site owner could seek to identify what happened on June 13 in order to find ways to avoid similar site slowdowns in the future.
Moving further down the Page Timings section, set the primary dimension for the lower section to Browser, clicking Other, Technology, and eventually Browser.

There are many dimensions to review in the Page Timings section, so don’t be afraid to explore.
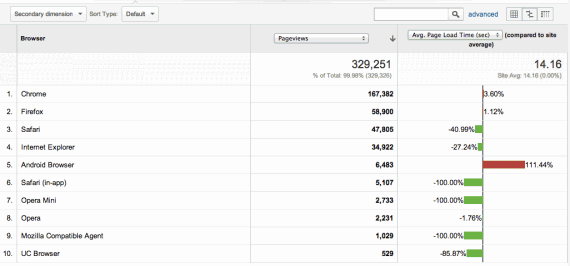
Set up the table so that the first column is “Browser,” the second column is “pageviews,” and the third column is “average page load times” as compared to the site’s average page load time. In the example below, Chrome is by far the most popular web browser among site visitors with 167,382 pageviews for the time period in view. Unfortunately, it seems that the site loaded about 3.6 percent more slowly in this top browser. Even more alarming is the Android browser, which is the fifth most popular on the site with almost 6,500 pageviews. That browser loads 111.44 percent more slowly than the site average. This sort of insight may cause the site owner to look closely at why the most popular browser and a popular mobile browser take longer than average to load.

The Page Timings section shows that site load times can differ by browser and other dimensions.
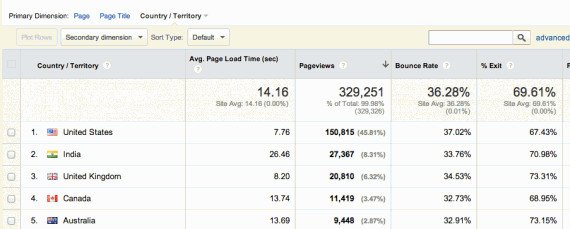
For another example of how to use the Page Timings section, reset the lower portion of the page’s primary dimension to Country/Territory, which can be found under Other, Users, and Country. Switch to the grid view, which is identified with the grid icon to the right of the advanced link.
In the example shown below, the United States is the leading source of traffic, and its users enjoy much faster than average load times at about 7.76 seconds. Interestingly, India is the second most common source of pageviews with 8.31 percent of the total. Unfortunately, users located in India must typically wait 26.46 seconds for the site to load. This may be an indication that Indian users generally have lower bandwidth at their disposal, which could lead some site owners to consider using a content delivery network with servers in India to lower latency or, perhaps, offer an easier to download version of the site to Indian visitors.

The Site Speed reports may also be used to identify underserve audience segments or opportunities.
Explore the Page Timings section to find many, many more insights about pages and page performance.
The Speed Suggestions Section
Google Analytics goes a step further than normal, providing not just the data found in the Page Timings section, but offering specific advice about how an individual page’s load times might be improved.
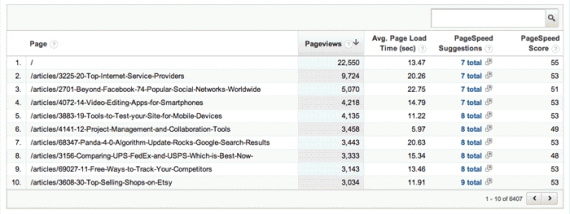
When you open the Speed Suggestions section there is a table sorted by the most popular pages in terms of pageviews. Notice that each page’s average load time is included. There is also a PageSpeed score in the far right column. A score of 100 means that the page, as far as Google is concerned, is doing everything right in terms of page performance optimization. Other scores are relative, so a score of 50 means that there is a lot of potential for improvement. A score of 100, however, does not necessarily mean a page will load faster a page with a lower score, just that at the browser everything is being done to optimize load times. A massive database query, as an example, at the server can slow down any page regardless of PageSpeed score.

The Speed Suggestions section shows a table sorted by the most popular pages in terms of pageviews.
Notice also that most pages will include a link to actual suggestions for improving page load times. Clicking the link opens a new window from the Google Developer site, where there are suggestions for both the mobile and desktop version of the site. In many cases, businesses with need a developer to make the changes Google suggests, but the benefits in performance can be significant.
There is a lot more to find in Google Analytics Site Speed reports. Poke around.


