
Gary Angel, one of the sharpest digital analytics practitioners, regularly cites the benefits of segmenting traffic in Google Analytics.
He says, “In every case, as you think about [specific metrics for your site], segmentation is an excellent first step for choosing the right explanation. If traffic for a site is rising, the first question I’d ask is ‘With whom?’ Is traffic rising for existing customers, for online only customers, or just prospects? If revenue is going up, I’d want to know exactly the same thing. Is revenue going up with all customers, or is it going up with customers who purchase high-end merchandise or is it up because we’re getting more customers?”
Angel’s points are well taken. Even for the most straightforward of ecommerce sites, with a basic implementation of Google Analytics, introducing segmentation to the analysis makes sense.
In this article, I will explore (a) potential ways to segment the traffic to your site in Google Analytics, (b) how to isolate those segments, and (c) what to look for in the data.
Accessing Advanced Segments
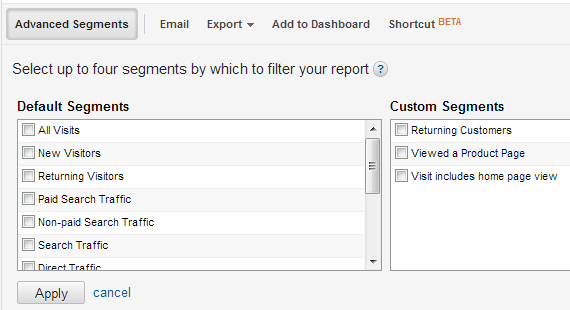
For any Google Analytics report, an “Advanced Segments” button appears just below the report name. Clicking this button opens a list of segments. You can select up to four of them, as shown below.


Select up to four segments and click “Apply.” These segments will then be applied to all reports until you re-open the window and deselect them.
To illustrate, the following image shows the ecommerce conversion rate for a site with three segments selected: New Visitors, All Visitors, and Returning Visitors.
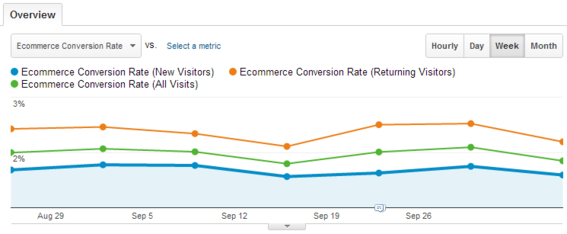
The conversion rate for three segments: New Visitors, All Visitors, Returning Visitors.
As is typical, returning visitors (orange line) convert at a higher rate than new visitors to the site (blue line). And, the overall conversion rate (green line) falls in between the two. Note that in Google Analytics, visitors can fall into multiple segments at once.
Default Segments vs. Custom Segments
Google Analytics includes a number of “default” segments. These cover the typical ways that traffic to websites can be meaningfully sliced. They cannot be edited or deleted, and their underlying configuration cannot be directly viewed. In most cases, that is fine. But, in some cases, the default segments can be ambiguous.
For instance, there is a Mobile Traffic segment. You may or may not expect tablets — such as the iPad — to be included in this segment. In fact, Google does treat traffic from tablets as being “mobile,” but you can only determine this by selecting the segment and then viewing the “Audience » Mobile » Devices” report.
Custom segments, on the other hand, are defined by you, which means they can be tailored to analyze aspects of traffic to your site that are unique and specific. You control the exact definition of the segment. Custom segments are associated with your user account; they are not automatically available to other users. Thus, if you log in to your Google account and create a segment, no other users can see that segment unless you share the segment definition with them, and they create the segment themselves.
Both types of advanced segments — i.e., default and custom — are useful. I will address default segments in this article, and custom segments in a subsequent one.
Starting Point Metrics
Virtually any report in Google Analytics, including custom reports, can be segmented. And, reports can be viewed across multiple segments for easy comparisons.
While there are no absolutes when it comes to what metrics are “right” for any given site, when analyzing traffic segments for ecommerce sites, I look at the following to see how they compare to the overall site, as well as to other relevant or related segments.
- Visits. This is the relative magnitude of traffic that meets the segment criteria. In some cases, the metric itself may be informative — “We’re getting almost no returning visitors to our site!”. But, more often, it is simply a check to ensure that you are not deeply dissecting a set of visitors to your site who account for very little traffic.
- Bounce rate. The bounce rate will vary widely across segments. For instance, returning customers naturally bounce at a much lower rate than new visitors. Look at the bounce rate, consider the segment, and see if you can logically explain why that segment has a higher, lower, or similar bounce rate to the overall site and related segments. If you can’t, then additional analysis may reveal that you are underserving a potentially valuable segment and can make changes to the site to address the issue.
- Ecommerce conversion rate. Like bounce rate, the ecommerce conversion rate will vary widely across segments. While that is expected, assessing the degree to which the conversion rate varies, and whether it make sense, can be a starting point for deeper analysis.
Depending on the specifics of your site, there may be other metrics that should be on this list.
Once a segment is identified that warrants further exploration — either because a metric is surprisingly out of whack with other segments or the rest of the site, or simply because you believe there is an opportunity to improve the experience for that group of visitors — there are any number of reports that can be used for deeper analysis. A good set of starting points include.
- Traffic sources. Assuming your segment is not based on a specific traffic source, then assessing where traffic is coming from in that segment can be revealing. For instance, are new visitors finding the site primarily through paid search, organic search, or specific non-search campaigns you have run?
- Landing pages. Landing pages are where visitors enter your site. For most sites, the home page is the top point of entry, but specific segments often have top landing pages that differ. Consider the content on the top landing pages in the context of the specific segment to spark ideas for adjusting what content is presented and how.
- Flow visualization. Flow visualization is one of the new features in Google Analytics. What it shows – by segment – are the top overall “paths” through your site. Can you logically explain why a particular segment has a propensity to take the top paths shown in this report? If so, have you considered the content along these paths from the perspective of each segment? Are there opportunities to adjust the content to better serve a particular segment?
In the balance of this article, I’ll address a number of segments – default and custom – that warrant consideration when digging into your site’s traffic. This list is not comprehensive, but it highlights some of the segments that I use most often on behalf of my clients.
New Visitors
The “New Visitors” default segment is a bit of a misnomer. But it is still useful. While the name implies that this segment includes all people who have never before visited your site, technically, it is broader than that. It includes all visitors to your site who have not visited it with the browser they’re currently using, and on the computer they’re currently using. And, even if the person has visited your site using the same computer and browser they are using during the current visit, if they have cleared their cookies since the last visit, Google Analytics will see him as a “new visitor.”
Despite that, the New Visitors segment is still a reasonable approximation of people who have never visited or seldom visit your site. Their experience of the site is likely much different from how you view it, since you’re use it every day, have a mental picture of the site’s organization, and know the shortest path to virtually all of the content. So exploring how new visitors behave can be eye opening.
Returning Visitors
The “Returning Visitors” default segment is just what it implies: Visitors to the site who Google Analytics can tell have been to the site before. Some visitors who have been to the site before will get missed by this segment — see the discussion of the New Visitors segment above — but it is virtually impossible for a visitor to appear in the Returning Visitors segment who has not previously visited the site.
This segment is a rough approximation of visitors who are “more loyal” to your site. They’ve been to the site before, and they have now returned. This doesn’t mean they were consciously coming back to the site because they thought it was amazing and useful, by any means. It may just be that they have searched for content on Google on separate occasions, and your site ranks highly for those terms.
Generally speaking, the returning visitors segment should perform better on your key metrics. The visitors have been to the site before, they’re coming back, and they have a degree of familiarity with how to find content. If returning visitors are not converting better than new visitors, there is potentially an opportunity worth exploring.
Non-paid Search Traffic
The “Non-paid Search Traffic” default segment represents visitors who reached your site by searching in Google or some other search engine and then clicking on one of the links that appeared in a non-paid-for spot on the results page. This segment shows you, very quickly, how much traffic is coming to your site by these means, as well as how those visitors behave relative to other segments.
There is an entire industry built around search engine optimization, and Google Analytics offers a number of reports specifically geared towards digging into what keywords and search engines are generating traffic to your site. Practical eCommerce author Jill Kocher has written many articles on how to analyze this segment, as well as how to change your site to improve the quantity and quality of this traffic.
Paid Search Traffic
The “Paid Search Traffic” default segment is also limited to visitors who reached the site following a search on Google, Bing, or some other search engine. But, this segment is limited to visitors who clicked on sponsored keywords or ads. If you are not running paid search campaigns, then this segment will show zero traffic.
If you are running paid search campaigns, then you are likely already getting paid search reports from the search engine itself. However, paid search platforms tend to focus their reporting on: how many times a link to your site was displayed, how many times a link was clicked, how much it cost you per click, and the number of conversions from paid search.
The Paid Search Traffic segment is a useful supplement to this data, because it enables you to get a much deeper view into how these visitors actually behaved on the site. If your paid search traffic has a high bounce rate, for instance, it may be that some of the keywords you are sponsoring are showing up in searches where people are looking for something very different to what your site offers.
Mobile Visitors and Tablet Visitors
Google Analytics offers a number of mobile reports that can tell you what portion of the traffic to your site is occurring on mobile devices, as well as what specific devices are being used. It also offers two default segments specifically for mobile traffic: Mobile Visitors includes phones and tablets, and Tablet Visitors includes only tablets.
With the growing use of iPhones, iPads, and Android devices, these are segments that should not be ignored. It can be difficult to rigorously test your site on a wide range of mobile devices. So starting with the conversion rate for mobile traffic overall, and then creating custom segments as warranted for specific devices that look like they might be trouble spots based on that segment, can reveal readily fixable broken spots on the site for visitors relying on specific mobile technologies.
Visitor Intent
Segmentation is a key starting point to analyze your site’s traffic. But its just the first part of a deeper analysis. The second part is drilling one level deeper into the segments to capture the intent of the visitors — why they came to the site in the first place. Actually measuring this can get quite complex. However, here are two simple steps to help.
- Validate what you infer is going on with a particular segment by asking — via an on-site survey, usability testing, or simply surveying a portion of your database, — to test your theories as to what is occurring.
- Segment your traffic based on visitor intent — most site survey tools enable passing visitor data into Google Analytics. iPerceptions 4Q is one of the most affordable, and is easy to implement integrate. This data can then be used to segment traffic based on the actual voice of the customer. For instance, what are new visitors to the site trying to do, and are they successful?
Summary
In short, segmentation, like other techniques for site analytics, is not a panacea. But it’s a helpful place to start to get a richer, deeper understanding of the visitors to your site.


